Profiling Inkscape startup performance

Hello everyone,
While I'm an Inkscape user for some years now, I'm fairly new to it from a developer point of view. In terms of performance, I've been recently doing some analysis with the help of cpu profiling tools. My aim in this mail is to present some of the things I noticed and maybe some ideas how to improve them.
The tools I've been using are the gperftools and more recently the linux performance tool `perf` together with FlameGraphs (Disclaimer: Since I've been using them for the first time I don't have a deep knowledge about them). Both tools can capture the stack at a timed interval, so it is possible to estimate how much time is spent in different functions. These can be visualized for example by a flame graph which I found quite handy. In theses graphs the x-axis shows the stack records alphabetically sorted (not chronologically) and if possible merged. The y-axis shows the call stack.
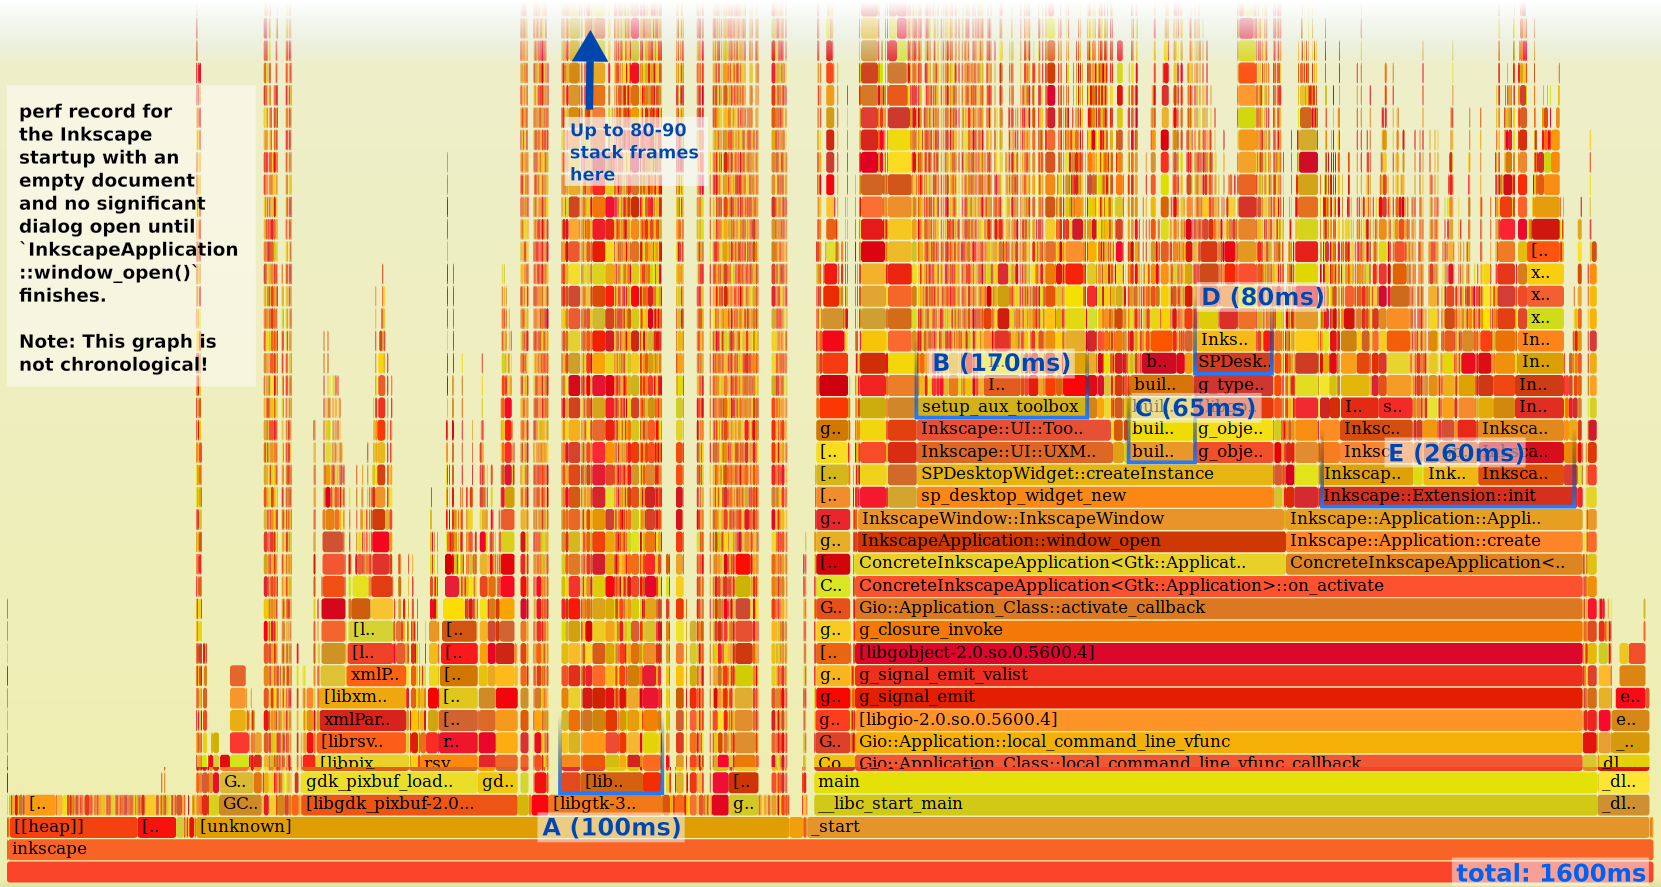
Recording the startup of Inkscape just until before the Window shows up[1] results in the attached results[2]. The original file is an SVG file (Note: This is a large interactive SVG and primarily intended to be opened in a browser[3]). By looking at the result I identified some parts that might be of interest (See annotated PNG file).
- A - (100ms): Based on some individual function calls (e.g. get_preferred_width) I assume this is related to the layout calculations. Noteworthy is here that the stack mostly has a depth of up to 80-90 frames. I don't know whether this is usual for gtk, but for me this looks like the calculation of the layout might get very complex. Maybe it is possible in some places to simplify the layout (I'm referring e.g. to [4]). While this part only takes around 100ms in this record, the actual impact could be larger because the recording stops just before the window shows up. However, even after it shows there is a noticeable delay until it gets responsive.
- B - (170ms): This part is the setup of the toolboxes at the top. I find interesting here that with the exception of the TextToolbar, each Toolbar only takes 5-10ms to load, but because there are so many of them, they sum up over 100ms (again without the TextToolbar). One idea I'll therefore try to look into in the next time is whether it is possible to lazy-load them, so that the GUI relevant initialization only runs as soon as required (when the tool is used the first time). Since most toolbars initialize in up to 10ms the delay is insignificant when clicking on a tool.
- C and D - (65ms / 80ms): These relate to the initialization of the menu resp. the DesktopWidget. I haven't had a much closer look yet, but both take longer than I assumed. There might be some optimizations possible as well (e.g. I noticed SwatchesPanel::_rebuild is called at least twice, each running nearly 20ms).
- E - (260ms): The last section is about loading the extensions. I don't know a lot about the extensions system now and the future plans, but I also wouldn't have expected this part to take that much time.
- Looking further - The attached recording of the startup here is of course only a part of interesting parts for optimization (And there are also a lot of parts that I cannot identify with certainty).
One second aspect I want to look more into is for example the fill and stroke dialog, which takes up to 600ms to load (not part of the attached profiling) because all marker images are expensively loaded and rendered as SPObjects at runtime. And if it is open on startup this time adds up to the delay before the window even shows up.
--
All in all I admit that this a rather chaotic collection of maybe or maybe not promising parts for performance optimizations. This surely only touches the surface of possible analysis and improvements, but I wanted to share this early because maybe you have some ideas as well (or there were some things done in the past that I don't know of). If you have any feedback I'd appreciate it a lot.
Best regards, octycs
[1] I did this by calling exit just before `InkscapeApplication::window_open` returns. [2] The results still have parts that are marked as "[unknown]". I tried solving this by passing "-fno-omit-frame-pointer" (see FlameGraph documentation for more), but this did not have an effect. Though this could also be because cmake automatically re-ran when I started building. [3] Direct link: https://octycs.eu/static/shared/190608_perf_startup_999hz.svg [4] https://gitlab.com/inkscape/inkscape/issues/9#note_132218218
participants (1)
-
 octycs