
Inkscape Issues Date : Started this on 28 March 2007
Version : 0.45.1 self-compiled on Kubuntu Dapper (32 bit version) Machine : Brand new AMD 64x2, Gigabyte m/b, 1 gig DDR2 RAM, lots of drive space (old IDE drives), PCI-Express nvidia card of no particular specs. (My old machine literally went boom!)
I reported this slowing-down on my last machine (an old AMD 1 ghz) on the inkscape-users list. I was very surprised to see the same thing on my new machine. I apt-get installed the build requirements (as per the Inkscape wiki) and compiled 0.45.1 to see if that would boost performance, it *was* much quicker but the slow-down still happens.
Inkscape starts nice and fast. For example panning is very quick, even with a complex drawing. After a time, perhaps 20/30 minutes, the panning becomes choppy and then unusable. I find it quicker to zoom out and zoom-in to a new area than to pan across to it.
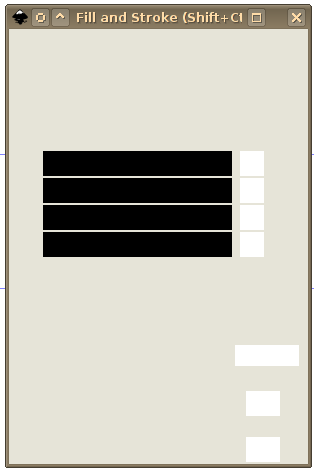
After a time the GTK dialogs start to draw very slowly. I have noticed this on: 1. The fill/stroke dialog (particular culprit) 2. The Doc properties 3. The Global prefs 4. Export sub-dialogs like the 'confirm file replace' dialogue. 5. Now and then on the Font dialog
After they begin to 'go slow' they quickly stop working at all. I often get blank forms (see attached -- assuming it does not get stripped.) BTW - This is the only GTK app that does this. Pan, Gimp, Tomboy, FontyPython, Firefox all work fine, if slowly.
When I feel Inkscape slowing, I save and restart it. Inkscape can take up to 30 seconds to close. The entire machine is non-responsive during that time. Music playing usually stutters and while the mouse will move around, nothing can be clicked or dragged.
Is there something I can do to help diagnose this? Can I compile with other flags (I am clueless about gcc/g++) in order to produce debug info or something? Or perhaps there is a trick to track memory useage to a logfile that I can post?
Could this issue be a problem with the quality of the supporting libraries as released on Kubuntu Dapper? I have always thought GTK apps were easily half the speed of QT apps on Kubuntu Dapper (and before that Fedora Core 1 and 3).
Please let me know what I can do to help, I am not well so I often fall off the net, but I thought I needed to let you know about my experiences.
Donn.

On Wed, 2007-03-28 at 11:31 +0200, Donn wrote:
When I feel Inkscape slowing, I save and restart it. Inkscape can take up to 30 seconds to close. The entire machine is non-responsive during that time. Music playing usually stutters and while the mouse will move around, nothing can be clicked or dragged.
It sounds like you are running out of available RAM and the machine is using swap heavily. This is not an Inkscape problem in particular, except to the extent that Inkscape is using a lot of memory.
How much RAM do you have in your machine?
-mental
How much RAM do you have in your machine?
As stated in my OP - 1 gig DDR2. This is 500mb more than I used to have and the problem with Inkscape is the same -- so I agree it seems to be memory-related -- a leak of some kind.
I have not noticed a problem with other apps. I use things like: Firefox, Pan, Blender, Gimp, Koffice, OOO, Kmail all the time.
/d
On Wed, 2007-03-28 at 12:33 +0200, Donn wrote:
As stated in my OP - 1 gig DDR2. This is 500mb more than I used to have and the problem with Inkscape is the same -- so I agree it seems to be memory-related -- a leak of some kind.
Yeah, I'd agree, and it's almost certainly a memory leak (or leaks) in Inkscape. You can probably verify this by checking About|Memory... periodically.
Are there particular tools or features you use heavily? That may help us narrow things down a bit, since most people don't have as much of a problem with memory consumption.
-mental
Yeah, I'd agree, and it's almost certainly a memory leak (or leaks) in Inkscape. You can probably verify this by checking About|Memory... periodically.
I do look at that dialog, but I don't really grok it. Is there a way to keep a running log of RAM use perhaps?
Are there particular tools or features you use heavily? That may help us narrow things down a bit, since most people don't have as much of a problem with memory consumption.
Not really. I like to snap to grid a bit, use layers. I don't even use alpha or gradients much. I almost never use blur (really slows things). Really, compared to the stuff in the screenshots section of Inkscape I am a lightweight user - laying out graphic design of a very simple nature.
I cannot believe that I am the only one to experience this - like my own personal curse :) There must be a way I can bring it from a personal experience into something with hard data so that devs say "Oh crap!" and can do stuff.
/d

On 3/28/07, Donn <donn.ingle@...400...> wrote:
Yeah, I'd agree, and it's almost certainly a memory leak (or leaks) in Inkscape. You can probably verify this by checking About|Memory... periodically.
I do look at that dialog, but I don't really grok it. Is there a way to keep a running log of RAM use perhaps?
Try running 'top' in a terminal. It should give you idea whether the slowness comes from heavy CPU usage (the CPU column) or from memory exhaustion (the MEM column) and if latter, what % of memory gets eaten before the slowness starts.
Try running 'top' in a terminal. It should give you idea whether the slowness comes from heavy CPU usage (the CPU column) or from memory exhaustion (the MEM column) and if latter, what % of memory gets eaten before the slowness starts.
Okay - it's still a little random really - I would have to watch top and write the numbers down on paper - is there no way to spool those two columns out to a file for the inkscape process?
/d

On 3/28/07, Donn <donn.ingle@...400...> wrote:
Try running 'top' in a terminal. It should give you idea whether the slowness comes from heavy CPU usage (the CPU column) or from memory exhaustion (the MEM column) and if latter, what % of memory gets eaten before the slowness starts.
Okay - it's still a little random really - I would have to watch top and write the numbers down on paper - is there no way to spool those two columns out to a file for the inkscape process?
/d
Maybe you can write regularly the output of a filtered "ps aux" to a file. Something like : while 1; do ps aux | grep inkscape >> logfile sleep 60; done
Hope it helps, Romain

# from Donn # on Wednesday 28 March 2007 08:31 am:
Try running 'top' in a terminal. It should give you idea whether the slowness comes from heavy CPU usage (the CPU column) or from memory exhaustion (the MEM column) and if latter, what % of memory gets eaten before the slowness starts.
Okay - it's still a little random really - I would have to watch top and write the numbers down on paper - is there no way to spool those two columns out to a file for the inkscape process?
Periodically reading /proc/$INKSCAPE_PID/statm will tell you your memory usage in space-separated "pages" (typically 4KB each.) See `man proc`.
--Eric

On Mar 28, 2007, at 8:31 AM, Donn wrote:
Okay - it's still a little random really - I would have to watch top and write the numbers down on paper - is there no way to spool those two columns out to a file for the inkscape process?
Generally top would give you some command line option to dump directly and exit, etc.
You can take that and pipe it through grep to isolate only Inkscape and then have that go into a file
I've forgotten the top options off hand, but I also work mainly on an OS X box, which is different. So just man on top should give you what you need there.
Periodically reading /proc/$INKSCAPE_PID/statm will tell you your memory usage in space-separated "pages" (typically 4KB each.) See `man proc`.
Okay so I did this: cripts:$ cat /proc/`pidof inkscape`/statm 29570 21732 4625 1280 0 17494 0 I have no idea what those numbers mean. Is this gonna be useful to a dev? Should I collect them over time and build up a little bit of history?
I confess the other suggestions with ps and top are (zip!) going over my head. man ps has to be the most intimidating text I have ever seen :o
/d
On Wed, 28 Mar 2007 18:53:10 +0200, Donn <donn.ingle@...400...> wrote:
I confess the other suggestions with ps and top are (zip!) going over my head. man ps has to be the most intimidating text I have ever seen :o
Personally I think some of the suggestions which have been made are a bit more involved than what is really needed.
I think the best thing to do is to simply write down the values in the "In Use" column from the "About Memory" dialog just after you've started Inkscape, then look and write them down again when Inkscape becomes sluggish (but before it's entirely unresponsive).
Those two sets of numbers should give us about as much information as we can get that particular way.
-mental
# from Donn # on Wednesday 28 March 2007 09:53 am:
usage in space-separated "pages" (typically 4KB each.) See `man proc`.
Okay so I did this: cripts:$ cat /proc/`pidof inkscape`/statm 29570 21732 4625 1280 0 17494 0 I have no idea what those numbers mean. Is this gonna be useful to a dev? Should I collect them over time and build up a little bit of history?
You could certainly do something like gather 1-second increments into a text file, then import that into a spreadsheet, read the proc manpage to get the column headings, multiply everything by 4, then graph it. If you grab timestamps with it and keep a written log of what you're doing, you can then compare spikes on the graph to given actions.
perl -e 'my $pid = shift; while(1) { open(my $fh, "<", "/proc/$pid/statm") or die; my $data = <$fh>; chomp($data); print join(" ", time,map({$_ * 4} split(/ /, $data))), "\n"; sleep(1); }' $(pidof inkscape)
--Eric
You could certainly do something like gather 1-second increments into a text file, then import that into a spreadsheet, read the proc manpage to get the column headings, multiply everything by 4, then graph it. If you grab timestamps with it and keep a written log of what you're doing, you can then compare spikes on the graph to given actions.
Er... yeah... And I'm sure it could be piped to the Mars Lander where it could be drawn in the Martian soil ten miles high too -- but not with my script-foo :)
/d
# from Donn # on Wednesday 28 March 2007 11:02 am:
Er... yeah... And I'm sure it could be piped to the Mars Lander where it could be drawn in the Martian soil ten miles high too -- but not with my script-foo :)
Uh... The script that I sent does it for you? How much more fu do you need?
--Eric
Okay, spent some time and have recorded these values. hth /d
1. Manually recorded from the Memory window in Inkscape:
Startup : 19:18 28 March In Use column, first 2 rows 34,005,xxx 3,248,128
19:23 81,543,xxx 15,675,xxx
19:41 103,288,xxx 32,546,816
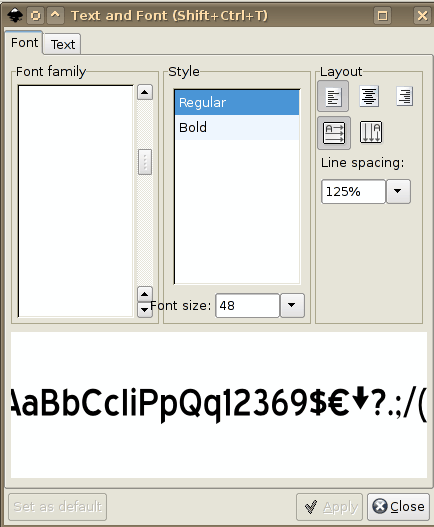
19:54 Opened Text dialog - no fonts appear. (attached screeny) 116,685,xxx 39,489,536
20:00 147,288,xxx 45,608,960
20:05 - slow-down begins in panning 182,511,464 55,853,056
20:13 - drawing things is slow. Sluggish. 168,177,xxx 48,803,840
20:19 - fonts come back to the font dialog 209,829,xxx 57,987,072
20:24 slowness 276,764,xxx 55,500,800
20:38 - doing some exporting 225,065,xxx 54,050,816
20:42 - No drastic failure. Must stop for the night. 231,870,xxx 57,327,616
2. Recorded by this script: pid=`pidof inkscape` while [[ 1 ]] do cat /proc/$pid/statm >> ~/inkscape.log sleep 60; done
Starting at the same time, so going up in 1 minute ( I think ) intervals:
18290 10796 4403 1280 0 6315 0 21316 13814 4500 1280 0 9240 0 30800 23016 4547 1280 0 18717 0 32481 24282 4611 1280 0 20309 0 32481 24285 4613 1280 0 20309 0 32629 24409 4642 1280 0 20325 0 35927 27052 4644 1280 0 23623 0 37003 29318 4653 1280 0 24699 0 37006 29344 4670 1280 0 24702 0 39762 32024 4663 1280 0 27458 0 39762 32020 4659 1280 0 27458 0 39799 32054 4688 1280 0 27495 0 40136 32441 4717 1280 0 27832 0 40453 32721 4718 1280 0 28149 0 42000 34181 4724 1280 0 29696 0 42369 34504 4724 1280 0 30065 0 42415 34670 4724 1280 0 30111 0 42347 34603 4724 1280 0 30043 0 42347 34614 4724 1280 0 30043 0 44088 36150 4724 1280 0 31784 0 45627 36229 4724 1280 0 33323 0 45643 36315 4724 1280 0 33339 0 45643 36332 4711 1280 0 33339 0 45691 37562 4710 1280 0 33387 0 45691 37560 4708 1280 0 33387 0 45691 37559 4707 1280 0 33387 0 45691 37559 4707 1280 0 33387 0 45691 37559 4707 1280 0 33387 0 45691 37559 4707 1280 0 33387 0 45691 37559 4707 1280 0 33387 0 47771 38356 4707 1280 0 35467 0 47803 39452 4707 1280 0 35499 0 47803 39293 4681 1280 0 35499 0 47803 39262 4677 1280 0 35499 0 47803 39442 4677 1280 0 35499 0 47803 39114 4348 1280 0 35499 0 47816 39051 4354 1280 0 35499 0 47816 38971 4274 1280 0 35499 0 47816 38979 4282 1280 0 35499 0 47816 38948 4251 1280 0 35499 0 49896 40876 4210 1280 0 37579 0 49896 40894 4210 1280 0 37579 0 49912 40159 4161 1280 0 37595 0 49979 38591 4161 1280 0 37662 0 49979 38397 4160 1280 0 37662 0 49979 37091 4160 1280 0 37662 0 49979 37019 4159 1280 0 37662 0 49979 36998 4159 1280 0 37662 0 57081 43398 4159 1280 0 44764 0 57081 43398 4159 1280 0 44764 0 57081 43398 4159 1280 0 44764 0 57081 43398 4159 1280 0 44764 0 57081 43312 4159 1280 0 44764 0 57051 44297 4161 1280 0 44734 0 57051 43948 4152 1280 0 44734 0 57051 44096 4208 1280 0 44734 0 57051 44127 4209 1280 0 44734 0 57051 44190 4209 1280 0 44734 0 57051 44189 4207 1280 0 44734 0 57051 44206 4208 1280 0 44734 0 57051 44195 4204 1280 0 44734 0 62408 49345 4193 1280 0 50091 0 64305 51198 4188 1280 0 51988 0 66247 53033 4188 1280 0 53930 0 68323 55010 4186 1280 0 56006 0 67997 54637 4184 1280 0 55680 0 67997 54294 3999 1280 0 55680 0 80766 66191 3977 1280 0 68449 0 75848 61238 3968 1280 0 63531 0 75880 61301 3968 1280 0 63563 0 75880 61216 3966 1280 0 63563 0 75880 61260 3968 1280 0 63563 0 75880 61198 3958 1280 0 63563 0 77928 61350 4017 1280 0 65611 0 77928 61376 4015 1280 0 65611 0 77928 61442 4015 1280 0 65611 0 77928 61411 4001 1280 0 65611 0 77944 61620 3973 1280 0 65627 0 77961 62095 4047 1280 0 65644 0 77960 60908 4009 1280 0 65643 0 77777 61621 4016 1280 0 65460 0 77777 61626 4016 1280 0 65460 0 77777 61626 4016 1280 0 65460 0 77777 61626 4016 1280 0 65460 0 77777 61609 4016 1280 0 65460 0 77777 62085 4106 1280 0 65460 0

He mentions zooming out. Wouldn't this be partly attributable to Inkscape's long-standing problem with slow rendering at high zoom?
bob
He mentions zooming out. Wouldn't this be partly attributable to Inkscape's long-standing problem with slow rendering at high zoom?
Hi - Actually zooming is nice and fast, it's panning that's slow, at any zoom. Well, panning gets slow after some time. When the app is first run, it's nice and quick -- after a while it becomes faster for me to zoom out (with the wheel and ctrl) and then zoom in (to where the cursor is) than it is to pan across to the next area.
/d
Donn wrote:
Hi - Actually zooming is nice and fast, it's panning that's slow, at any zoom. Well, panning gets slow after some time. When the app is first run, it's nice and quick -- after a while it becomes faster for me to zoom out (with the wheel and ctrl) and then zoom in (to where the cursor is) than it is to pan across to the next area.
Exactly. Not the zoom itself, but the re-rendering while you are zoomed-in.
What - was this not helpful? Perhaps someone can tell me at what figure these numbers would show a leak?
/d
On Wednesday 28 March 2007 20:49, Donn wrote:
Okay, spent some time and have recorded these values. hth /d
- Manually recorded from the Memory window in Inkscape:
Startup : 19:18 28 March In Use column, first 2 rows 34,005,xxx 3,248,128
19:23 81,543,xxx 15,675,xxx
19:41 103,288,xxx 32,546,816
19:54 Opened Text dialog - no fonts appear. (attached screeny) 116,685,xxx 39,489,536
20:00 147,288,xxx 45,608,960
20:05 - slow-down begins in panning 182,511,464 55,853,056
20:13 - drawing things is slow. Sluggish. 168,177,xxx 48,803,840
20:19 - fonts come back to the font dialog 209,829,xxx 57,987,072
20:24 slowness 276,764,xxx 55,500,800
20:38 - doing some exporting 225,065,xxx 54,050,816
20:42 - No drastic failure. Must stop for the night. 231,870,xxx 57,327,616
- Recorded by this script:
pid=`pidof inkscape` while [[ 1 ]] do cat /proc/$pid/statm >> ~/inkscape.log sleep 60; done
Starting at the same time, so going up in 1 minute ( I think ) intervals:
18290 10796 4403 1280 0 6315 0 21316 13814 4500 1280 0 9240 0 30800 23016 4547 1280 0 18717 0 32481 24282 4611 1280 0 20309 0 32481 24285 4613 1280 0 20309 0 32629 24409 4642 1280 0 20325 0 35927 27052 4644 1280 0 23623 0 37003 29318 4653 1280 0 24699 0 37006 29344 4670 1280 0 24702 0 39762 32024 4663 1280 0 27458 0 39762 32020 4659 1280 0 27458 0 39799 32054 4688 1280 0 27495 0 40136 32441 4717 1280 0 27832 0 40453 32721 4718 1280 0 28149 0 42000 34181 4724 1280 0 29696 0 42369 34504 4724 1280 0 30065 0 42415 34670 4724 1280 0 30111 0 42347 34603 4724 1280 0 30043 0 42347 34614 4724 1280 0 30043 0 44088 36150 4724 1280 0 31784 0 45627 36229 4724 1280 0 33323 0 45643 36315 4724 1280 0 33339 0 45643 36332 4711 1280 0 33339 0 45691 37562 4710 1280 0 33387 0 45691 37560 4708 1280 0 33387 0 45691 37559 4707 1280 0 33387 0 45691 37559 4707 1280 0 33387 0 45691 37559 4707 1280 0 33387 0 45691 37559 4707 1280 0 33387 0 45691 37559 4707 1280 0 33387 0 47771 38356 4707 1280 0 35467 0 47803 39452 4707 1280 0 35499 0 47803 39293 4681 1280 0 35499 0 47803 39262 4677 1280 0 35499 0 47803 39442 4677 1280 0 35499 0 47803 39114 4348 1280 0 35499 0 47816 39051 4354 1280 0 35499 0 47816 38971 4274 1280 0 35499 0 47816 38979 4282 1280 0 35499 0 47816 38948 4251 1280 0 35499 0 49896 40876 4210 1280 0 37579 0 49896 40894 4210 1280 0 37579 0 49912 40159 4161 1280 0 37595 0 49979 38591 4161 1280 0 37662 0 49979 38397 4160 1280 0 37662 0 49979 37091 4160 1280 0 37662 0 49979 37019 4159 1280 0 37662 0 49979 36998 4159 1280 0 37662 0 57081 43398 4159 1280 0 44764 0 57081 43398 4159 1280 0 44764 0 57081 43398 4159 1280 0 44764 0 57081 43398 4159 1280 0 44764 0 57081 43312 4159 1280 0 44764 0 57051 44297 4161 1280 0 44734 0 57051 43948 4152 1280 0 44734 0 57051 44096 4208 1280 0 44734 0 57051 44127 4209 1280 0 44734 0 57051 44190 4209 1280 0 44734 0 57051 44189 4207 1280 0 44734 0 57051 44206 4208 1280 0 44734 0 57051 44195 4204 1280 0 44734 0 62408 49345 4193 1280 0 50091 0 64305 51198 4188 1280 0 51988 0 66247 53033 4188 1280 0 53930 0 68323 55010 4186 1280 0 56006 0 67997 54637 4184 1280 0 55680 0 67997 54294 3999 1280 0 55680 0 80766 66191 3977 1280 0 68449 0 75848 61238 3968 1280 0 63531 0 75880 61301 3968 1280 0 63563 0 75880 61216 3966 1280 0 63563 0 75880 61260 3968 1280 0 63563 0 75880 61198 3958 1280 0 63563 0 77928 61350 4017 1280 0 65611 0 77928 61376 4015 1280 0 65611 0 77928 61442 4015 1280 0 65611 0 77928 61411 4001 1280 0 65611 0 77944 61620 3973 1280 0 65627 0 77961 62095 4047 1280 0 65644 0 77960 60908 4009 1280 0 65643 0 77777 61621 4016 1280 0 65460 0 77777 61626 4016 1280 0 65460 0 77777 61626 4016 1280 0 65460 0 77777 61626 4016 1280 0 65460 0 77777 61609 4016 1280 0 65460 0 77777 62085 4106 1280 0 65460 0
On Thu, 2007-03-29 at 10:32 +0200, Donn wrote:
What - was this not helpful? Perhaps someone can tell me at what figure these numbers would show a leak?
I think most of the developers are still asleep, though they may also be puzzled. It doesn't look like a particularly severe leak if there is one. ~300MB virtual size shouldn't be forcing a machine with 1GB of RAM into swap.
If the problem is indeed Inkscape, the only thing I can think of would be something like massive spikes in memory consumption, where the memory was still quickly freed again, and therefore missed at the sample intervals we took.
Since this behavior seems to be related to the general slowness-on-zoom issues, it may be that livarot's (our renderer's) tessellation code is exhibiting such behavior. That's a tenuous guess on my part right now though.
-mental
# from MenTaLguY # on Thursday 29 March 2007 01:47 am:
If the problem is indeed Inkscape, the only thing I can think of would be something like massive spikes in memory consumption, where the memory was still quickly freed again, and therefore missed at the sample intervals we took.
It might be useful to use the script that I mentioned earlier with the one-second intervals, then graph the seconds column against the first memory column and maybe you'll see some big spikes. The one-minute intervals look somewhat suspicious simply judging by the steady climb to 300+MB. This might be justified, depending on what you're drawing.
Below it is in minutes and KB. It only drops once at 20:24, which is when you mentioned noticing slowness.
Your log doesn't doesn't mention opening files. Is this all from one drawing?
17 73160 18 85264 19 123200 20 129924 21 129924 22 130516 23 143708 24 148012 25 148024 26 159048 27 159048 28 159196 29 160544 30 161812 31 168000 32 169476 33 169660 34 169388 35 169388 36 176352 37 182508 38 182572 39 182572 40 182764 41 182764 42 182764 43 182764 44 182764 45 182764 46 182764 47 191084 48 191212 49 191212 50 191212 51 191212 52 191212 53 191264 54 191264 55 191264 56 191264 57 199584 58 199584 59 199648 00 199916 01 199916 02 199916 03 199916 04 199916 05 228324 06 228324 07 228324 08 228324 09 228324 10 228204 11 228204 12 228204 13 228204 14 228204 15 228204 16 228204 17 228204 18 249632 19 257220 20 264988 21 273292 22 271988 23 271988 24 323064 25 303392 26 303520 27 303520 28 303520 29 303520 30 311712 31 311712 32 311712 33 311712 34 311776 35 311844 36 311840 37 311108 38 311108 39 311108 40 311108 41 311108 42 311108
Eric,
It might be useful to use the script that I mentioned earlier with the one-second intervals, then graph the seconds column against the first memory column and maybe you'll see some big spikes.
I will get onto it as soon as I get a chance, I promise.
The one-minute intervals look somewhat suspicious simply judging by the steady climb to 300+MB. This might be justified, depending on what you're drawing.
I was pushing it a little this time with gradients and 2 blurred clones. Still, compared to the stuff I see done with Inkscape it's really not that extreme. I would send it to you but I see the filesize is 1.9Mb (due to a logo with text to curves). I'll try chop it down and get a working example that I can share.
Below it is in minutes and KB. It only drops once at 20:24, which is when you mentioned noticing slowness.
Your log doesn't doesn't mention opening files. Is this all from one drawing?
I opened an existing drawing to start and at one point I drag/dropped an svg (the logo) into the drawing.
I'll log more carefully next time too.
Thanks for the info, Donn.
puzzled. It doesn't look like a particularly severe leak if there is one. ~300MB virtual size shouldn't be forcing a machine with 1GB of RAM into swap.
When Ink is doing it's go-slow (+ blank form thing) I do not notice a slow-down in other apps. The only time the entire machine is non-responsive is when I close Inkscape after a go-slow. This is usually done by ctrl+alt+esc which gives me that little skull icon to clobber dead windows with. I also killall inkscape now and then. At that point the machine can "go away" for (I estimate) between 30 and 50 seconds. Serious lock-out.
If the problem is indeed Inkscape, the only thing I can think of would be something like massive spikes in memory consumption, where the memory was still quickly freed again, and therefore missed at the sample intervals we took.
I will take Eric's advice and try his script. I dunno if my forebrain is up to the whole graphing thing, but I'll do what I can :)
Since this behavior seems to be related to the general slowness-on-zoom issues, it may be that livarot's (our renderer's) tessellation code is exhibiting such behavior. That's a tenuous guess on my part right now though.
I must reiterate that the zooming is really quick - pretty much always.
I will try to explain the panning thing I see: 1. Start a fresh Ink - open a working file 2. Middle-button drag the canvas - there is a little flickering as it redraws, but five pixels (for example) mouse movement = five pixels of pan. 3. Time passes. Slowness sets in. 4. Middle-drag the canvas. Now 5 pixels of mouse movement = no panning at all. I have to drag the mouse across over half the screen before the canvas will pan only a small step (perhaps 50 or 100 pixels). So it's a lot of: a. Drag across screen. b. Let go - wait for a reallllly slow redraw with big black rectangles being filled by the drawing. c. Move mouse back across the screen. d. Goto a
So, I take to zooming with ctrl+mouse wheel in and out to move to new areas of a drawing. The zoom is damn quick. I don't understand it. When I get close to a dense area of the drawing (say fit-to-screen size) the slow redraw can get in the way, but I just wait it out. It's much much much better than panning.
So, the problems that Ink is throwing my way are: 1. Slowdown in "response" - most noticed when panning. But also in: a. The speed of the populating of dialogues like the fill/stroke dialogue. b. Selecting and deselecting gets very slow too. Sometimes select will not work at all and I must zoom out some before it will "see" what I am clicking. c. Very large slowdown when snapping to grid or paths. 2. Dialogues that malfunction - no fonts appear or no controls appear. 3. An eventual freeze and a forced app kill. * * I mostly notice the freeze when exporting to png. It will come up with a "cannot export this file" (I will try get the exact message) which is bogus because I have been doing it before. I think a form comes up that is asking me if I want to over-write an existing file or not but the controls are not visible and I cannot use "Enter" or "Esc" keys to control it.
/d
It might be useful to use the script that I mentioned earlier with the
Eric, how do I capture the output from that script into a log file? I gave it the name : ericlogger and tried: ./ericlogger >> logfile but that don't work. I don't know perl at all so my hacking is not getting me anywhere.
Here it is again:
perl -e 'my $pid = shift; while(1) { open(my $fh, "<", "/proc/$pid/statm") or die; my $data = <$fh>; chomp($data); print join(" ", time,map({$_ * 4} split(/ /, $data))), "\n"; sleep(1); }' $(pidof inkscape)
/d
# from Donn # on Thursday 29 March 2007 03:21 am:
It might be useful to use the script that I mentioned earlier with the
Eric, how do I capture the output from that script into a log file? I gave it the name : ericlogger and tried: ./ericlogger >> logfile but that don't work. I don't know perl at all so my hacking is not getting me anywhere.
Just paste to a shell. What I wrote was a command and script. Where did I lose you? The script is between the pair of single quotes. The required argument is the pid. The "$(pid of inkscape)" bit is just bash backticks (but the $() form nests, so that's my habit.)
perl -e 'my $pid = shift; while(1) { open(my $fh, "<", "/proc/$pid/statm") or die; my $data = <$fh>; chomp($data); print join(" ", time,map({$_ * 4} split(/ /, $data))), "\n"; sleep(1); }' $(pidof inkscape) > logfile
Or, if you want to put it in a file:
#!/usr/bin/perl # track_memory.pl my $pid = shift(@ARGV); while(1) { # read the proc data open(my $fh, "<", "/proc/$pid/statm") or die; my $data = readline($fh); chomp($data); # prepend the time and multiply blocks by 4KB print join(" ", time(), map({$_ * 4} split(/ /, $data) ) ), "\n"; sleep(1); }
That version has comments and uses some clearer constructs, but is otherwise equivalent.
Then you chmod +x and run:
./track_memory.pl $(pidof inkscape) > logfile
--Eric
Just paste to a shell. What I wrote was a command and script.
I made a file out of it to allow me to rerun it etc. The output goes to the shell, but after a while it gets too long and one cannot scroll up to copy it all. Thus my need for a file output.
Where did I lose you?
You didn't, bar my total non-clue about perl.
The script is between the pair of single quotes. The required argument is the pid. The "$(pid of inkscape)" bit is just bash backticks (but the $() form nests, so that's my habit.)
I got that.
perl -e 'my $pid = shift; while(1) { open(my $fh, "<", "/proc/$pid/statm") or die; my $data = <$fh>; chomp($data); print join(" ", time,map({$_ * 4} split(/ /, $data))), "\n"; sleep(1); }' $(pidof inkscape) > logfile
Does not work. I actually tried this one too. The logfile is blank. I tried >> as well, to no avail.
Or, if you want to put it in a file:
#!/usr/bin/perl # track_memory.pl my $pid = shift(@ARGV); while(1) { # read the proc data open(my $fh, "<", "/proc/$pid/statm") or die; my $data = readline($fh); chomp($data); # prepend the time and multiply blocks by 4KB print join(" ", time(), map({$_ * 4} split(/ /, $data) ) ), "\n"; sleep(1); }
Results in: scripts:$ ./eric2log $(pidof inkscape) > logfile ./eric2log: line 3: syntax error near unexpected token `(' ./eric2log: line 3: ` my $pid = shift(@ARGV);'
Sorry to be dense about this. Thx for the continued patience :)
/d
# from Donn # on Thursday 29 March 2007 10:51 am:
Just paste to a shell. What I wrote was a command and script.
I made a file out of it to allow me to rerun it etc. The output goes to the shell, but after a while it gets too long and one cannot scroll up to copy it all. Thus my need for a file output.
So it works, but quits working when you redirect the output? That's not a problem in my code and I can't see what's wrong from here.
Where did I lose you?
You didn't, bar my total non-clue about perl.
I don't think you're having any perl errors.
perl -e 'my $pid = shift; while(1) { open(my $fh, "<", "/proc/$pid/statm") or die; my $data = <$fh>; chomp($data); print join(" ", time,map({$_ * 4} split(/ /, $data))), "\n"; sleep(1); }' $(pidof inkscape) > logfile
Does not work. I actually tried this one too. The logfile is blank. I tried >> as well, to no avail.
Sorry, but "does not work" is not an error message I can parse.
Results in: scripts:$ ./eric2log $(pidof inkscape) > logfile ./eric2log: line 3: syntax error near unexpected token `(' ./eric2log: line 3: ` my $pid = shift(@ARGV);'
Undent the shebang! If you just pasted from e-mail, you have to start the #! on the first character of the first line or your shell will try to pretend it is a bash script.
scripts:$ perl eric2log $(pidof inkscape) > logfile
Note, you'll get the error message "Died" when the statm file isn't available. This means either at the very beginning (means you don't have inkscape running) or the very end (means you closed inkscape.)
--Eric
So it works, but quits working when you redirect the output? That's not a problem in my code and I can't see what's wrong from here.
Yes. Is there some way to get perl to write the logfile so we can skip bash interaction?
Does not work. I actually tried this one too. The logfile is blank. I tried >> as well, to no avail.
Sorry, but "does not work" is not an error message I can parse.
Um, I said "the logfile is blank" that would be my description of the problem.
Undent the shebang! If you just pasted from e-mail, you have to start the #! on the first character of the first line or your shell will try to pretend it is a bash script.
Stupid me! Sorted.
scripts:$ perl eric2log $(pidof inkscape) > logfile
Still "does not work" because the logfile is blank. Go figure.
If I remove the > logfile part it immediately logs to the console.
/d
On Thu, 29 Mar 2007 20:35:33 +0200, Donn <donn.ingle@...400...> wrote:
scripts:$ perl eric2log $(pidof inkscape) > logfile
Still "does not work" because the logfile is blank. Go figure.
If I remove the > logfile part it immediately logs to the console.
Try adding the line:
$| = 1;
to just below the shebang (#!) line, and see if that makes a difference.
-mental
Try adding the line:
$| = 1;
to just below the shebang (#!) line, and see if that makes a difference.
Okay, thx Mental, that's working now. Man! I thought we'd be debugging Inkscape not a perl script :D
It might be useful to use the script that I mentioned earlier with the one-second intervals, then graph the seconds column against the first memory column and maybe you'll see some big spikes.
A typical output is: 1175194222 84756 54988 17756 5120 0 36856 0 1175194223 84756 54988 17756 5120 0 36856 0
Which is the "seconds" column (no idea) and which is the "memory" column (my guess is col 1)? When I get a chance to do another 'crash-test' (prob on the weekend), I'll try some kind of spreadsheet thing.
Thanks, /d
On Thu, 29 Mar 2007 20:57:37 +0200, Donn <donn.ingle@...400...> wrote:
1175194222 84756 54988 17756 5120 0 36856 0 1175194223 84756 54988 17756 5120 0 36856 0
The first three columns are:
seconds (since Jan 1, 1970) total memory (in 4kB pages) memory resident in RAM (in 4kB pages)
-mental
# from MenTaLguY # on Thursday 29 March 2007 02:14 pm:
On Thu, 29 Mar 2007 20:57:37 +0200, Donn <donn.ingle@...400...> wrote:
1175194222 84756 54988 17756 5120 0 36856 0 1175194223 84756 54988 17756 5120 0 36856 0
The first three columns are:
seconds (since Jan 1, 1970) total memory (in 4kB pages) memory resident in RAM (in 4kB pages)
Yeah, but the memory printout is in KB now because I did the map({$_*4} multiplicative bit already.
--Eric
participants (7)
-
 Bob Jamison
 -
 bulia byak
 -
 Donn
Donn -
 Eric Wilhelm
 -
 Jon A. Cruz
 -
 MenTaLguY
 -
 Romain Thouvenin